We reported robust investment results in 2021, delivering a return of 3.7% even with volatile financial market conditions. Despite a challenging investment environment driven by pandemic-related economic woes such as the instability of global supply chains, our invested assets generated KRW 244.8 billion in investment income excluding foreign exchange gains/losses in 2021, compared to KRW 236.7 billion in 2020. Among others, our stock and alternative investment portfolios performed strongly, contributing to a rise in investment profit.
In 2021, economic recovery picked up steam both domestically and globally. The Korean economy rebounded sharply from the pandemic in 2021, with a GDP growth of 4.0%, the highest rate in 11 years. The global economy also recovered solidly from the recession caused by the COVID-19 pandemic, but not without challenges. The emergence of new variants of the coronavirus, global supply chain turbulence and soaring commodity prices presented obstacles to ongoing economic recovery.
As the economy regained strength, there was a shift in interest rate movement in 2021, bringing an end to the days of record low interest rates. In order to tackle a pandemic-driven economic downturn, the Bank of Korea cut its benchmark interest rate to an all-time low of 0.5% in 2020, but started to tighten its monetary policy during the second half of 2021. Amid rising inflation and household debt, the policy rate was stepped up twice to reach 1.0% at the end of the year.
Consequently, the yield on ten-year Korea treasury bonds soared to 2.25% on the last day of 2021, compared to 1.713% a year earlier. The stock market also experienced wild swings throughout the year. The Korea Composite Stock Price Index (KOSPI) hit an all-time high of 3,316.08p in June 2021, but tumbled to a yearly low of 2,839.01 at the end of November amid rising concerns over the potential impact of Omicron. KOSPI closed the year at 2,977.65, with the growing possibility of interest rate hikes.
Rising interest rates weighed on our overall bond performance in 2021. We saw our fixed-income returns decrease significantly, and investment income from bonds took up a smaller share of the entire investment profit. Returns from domestic and foreign bonds accounted for 22% and 23%, respectively, of the total investment income. In contrast, we achieved exceptional results for our alternative investments, with 51% of our investment income coming from the alternative asset class. Our stock investment portfolio also pulled off big gains on the back of our effective portfolio management and market rallies.
Backed by stable inflows of investment and premium income, we reported an 11.6% growth in the value of our investments, with total invested assets amounting to KRW 7,161.4 billion as of the end of 2021. While working to navigate tumultuous financial market conditions in 2021, we focused on ensuring the strength of our investment portfolio in a way that maximized the profitability of our invested assets throughout the year.
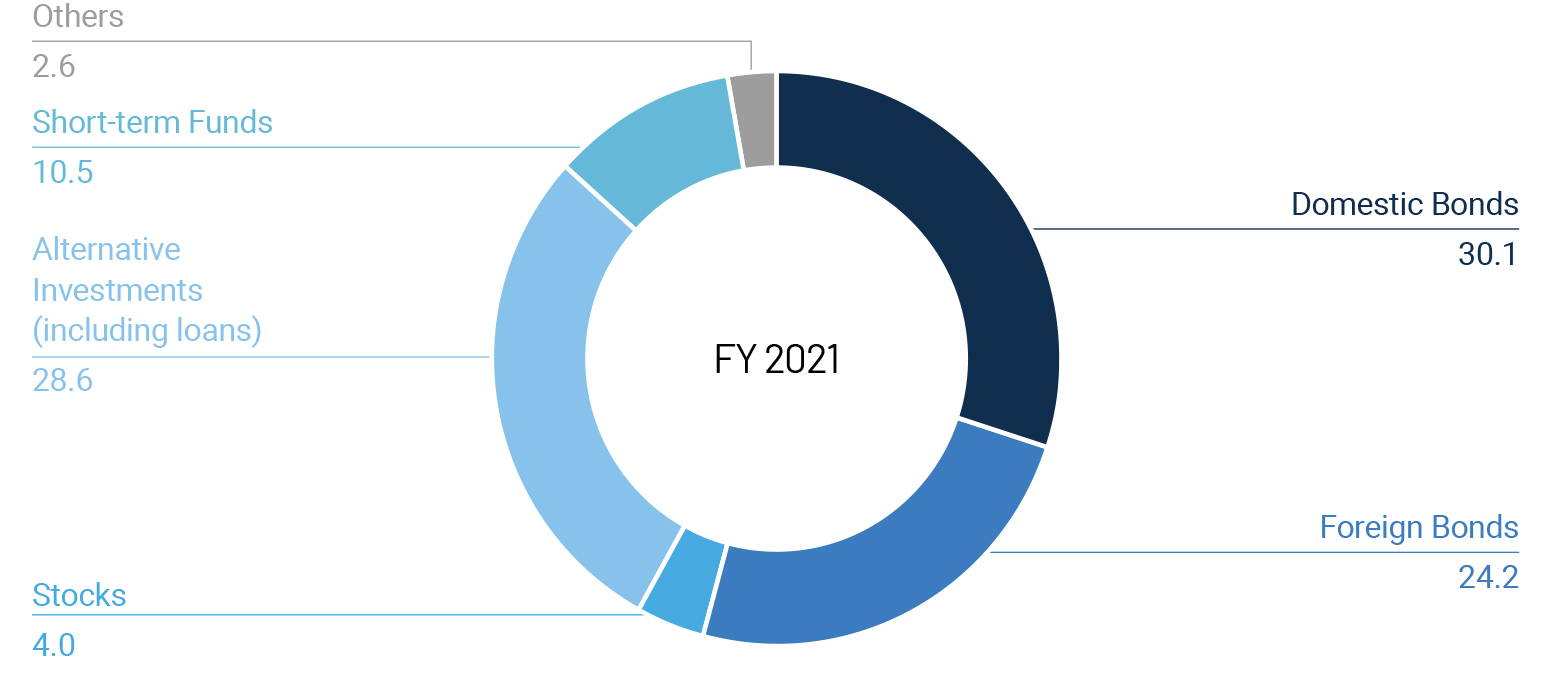
Domestic fixed-income securities made up the largest part of our portfolio, or 30.1% of the total invested assets. Our domestic bond holdings consist mainly of government bonds and other high-quality corporate bonds. As we have been continuously compelled to search for new investment opportunities in the current tough investment environment, the proportion of alternative investments including loans remained high at 28.6% of our total invested assets. Most of our alternative investment vehicles are loans – real estate loans, acquisition financing, and loan-linked products.
In 2022, the Korean economy is expected to maintain its recovery momentum, supported by the growth of the service industry. However, the growth of exports and facility investment, which mainly fueled the economic recovery in 2021, is likely to slow significantly when the global economy loses steam. The path to economic normalization will depend on factors like global supply chain disruptions, a steep rise in raw material prices, and the pace at which the coronavirus is kept in check. As the economy normalizes, the Bank of Korea, like other central banks in major countries, is expected to raise interest rates several times in 2022.
In light of this future outlook, we will hold steadfast to a portfolio strategy that can generate steady returns, particularly when faced with the possibility of any shock from interest rate hikes or other changes in economic conditions. This will help us maintain portfolios that are fundamentally sound and resilient against a potential increase in market uncertainty. Our Asset Management Team will remain committed to driving stable investment income over the long term in a way that supports the company’s financial strength in alignment with our business objectives.
Investment Results
(Units: KRW billion, USD million)
| FY 2021 (KRW) | FY 2021 (USD) | FY 2020 (KRW) | FY 2020 (USD) | |
| Invested Assets | 7,161.4 | 5,982.3 | 6,417.6 | 5,841.6 |
| Investment Income | 306.3 | 266.5 | 200.4 | 168.2 |
| Investment Income* | 244.8 | 213.0 | 236.7 | 198.6 |
| Yield (%) | 4.5 | 4.5 | 3.2 | 3.2 |
| Yield* (%) | 3.7 | 3.7 | 3.8 | 3.8 |
* Gains and/or losses from foreign exchange hedging for insurance liabilities have been excluded.
Invested Assets
(Units: KRW billion, USD million)
| FY 2021 (KRW) | FY 2021 (USD) | FY 2020 (KRW) | FY 2020 (USD) | |
| Domestic Bonds | 2,152.2 | 1,797.8 | 1,896.9 | 1,726.7 |
| Foreign Bonds | 1,730.1 | 1,445.2 | 1,585.8 | 1,443.5 |
| Stocks | 287.2 | 239.9 | 205.8 | 187.3 |
| Alternative Investments (including loans) | 2,050.8 | 1,713.1 | 1,955.7 | 1,780.2 |
| Short-term Funds | 755.8 | 631.4 | 587.5 | 534.8 |
| Others | 185.3 | 154.8 | 185.9 | 169.2 |
| Total | 7,161.4 | 5,982.3 | 6,417.6 | 5,841.6 |
✽ Individual figures may not add up to the total shown due to rounding.
Investment Income
(Units: KRW billion, USD million)
| FY 2021 (KRW) | FY 2021 (USD) | FY 2020 (KRW) | FY 2020 (USD) | |
| Domestic Bonds | 54.0 | 47.0 | 70.4 | 59.1 |
| Foreign Bonds | 118.2 | 102.8 | 57.4 | 48.2 |
| Foreign Bonds* | 56.7 | 49.3 | 93.7 | 78.6 |
| Stocks | 48.0 | 41.8 | 5.0 | 4.2 |
| Alternative Investments (including loans) | 125.1 | 108.8 | 60.4 | 50.7 |
| Short-term Funds | 7.0 | 6.1 | 9.4 | 7.9 |
| Others | -2.8 | -2.4 | -2.2 | -1.9 |
| Total | 306.3 | 266.5 | 200.4 | 168.2 |
| Total* | 244.8 | 213.0 | 236.7 | 198.6 |
* Gains and/or losses from foreign exchange hedging for insurance liabilities have been excluded.
✽ Individual figures may not add up to the total shown due to rounding.
Investment Portfolio Mix
(Units: %)